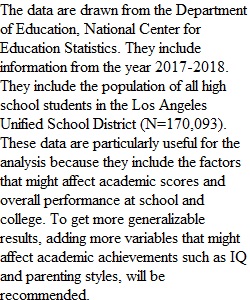
Q Data and Methods In this assignment you will produce YOUR data and methods sections for your final research project. Each student is required to conduct their own study. This assignment allows me to review your study and help guide you for success. Using the data I provided or another data set (must have my approval before you can proceed), locate data. Once you find a data set that has the variables you wish to use, write up your data and methods sections. I have included italicized text to help you see where to fill in your data and methods information. This allows you to see where to drop in your own words - please do not italicize your words. Please use my paragraphs -- this class is to teach you how to write like a scientist. You must follow the American Sociological Association (ASA) format and your sections should look exactly like the sections below (without the italicized fields -- you will fill in your data and methods information in those fields). DATA The data are drawn from the insert the data source agency here. They include information from the year/s insert the years of your data. They include the population/sample of insert the group being surveyed and include n=insert the number of cases in the study insert the unit of analysis here – people, nations, schools, etc.. These data are particularly useful for the analysis because they include measures of insert your measures here. The data are not perfect as they do not consider insert any draw backs or limitations here. Despite this limitation, they do consider the key measures of this study. {Choose population or sample. If your data include all people (like all college students) write "population"; if your data are a sample, write the word "sample." Choose year OR years - if your study is a snapshot of 1 year, use "year"; if it spans multiple years use "years."} METHODS The study will measure the effect of insert your independent variable here on insert your dependent variable here. It will compare insert the units of analysis here by insert race, class or gender here, specifically by considering how insert your measures here pattern the outcome of interest. An example of how your assignment submission should be written: DATA The data are drawn from the Department of Education, National Center for Education Statistics. They include information from the year 2017-2018. They include the population of all high school students in Los Angeles Unified School District (N=170,093). These data are particularly useful for the analysis because they include measures of race and gender and graduation rates. The data are not perfect as they do not consider students who have dropped out prior to 9th grade. Despite this limitation, they do consider the key measures of this study. METHODS The study will measure the effect of race and gender on graduation rates. It will compare male and female graduation rates in each racial category by considering how race patterns educational outcomes. Reminder -- here is a list of potential data sites for your study: LIST OF POTENTIAL DATA SITES FOR QUANTITATIVE RESEARCH CRIMINOLOGY Federal Bureau of Investigation, Uniform Crime Report Crime Data Explorer Links to an external site. Hate Crimes : https://ucr.fbi.gov/hate-crimeLinks to an external site. Officers Killed (Use the tables for data; do not use their figures): https://ucr.fbi.gov/leoka/2018/topic-pages/officers-feloniously-killedLinks to an external site. State of California Department of Justice https://openjustice.doj.ca.gov/exploration/crime-statisticsLinks to an external site. EDUCATION International (PISA) http://www.oecd.org/pisa/data/Links to an external site. PISA Data Explorer - 2015 Links to an external site. 2012Links to an external site. National National Center for Education Statistics (NCES) Report Card https://nces.ed.gov/nationsreportcard/naepdata/Links to an external site. State California Department of Education Data and Statistics https://dq.cde.ca.gov/dataquest/Links to an external site. LAVC Los Angeles Valley College https://www.lavc.edu/research/Data-Dashboards.aspxLinks to an external site. PUBLIC HEALTH Centers for Disease Control (CDC) http://www.cdc.gov/DataStatistics/Links to an external site. STRATIFICATION Global Inequality and Demographics CIA World Fact Book : CIA World Fact Book Links to an external site. WORK US Department of Labor, Bureau of Labor Statistics, Current Population Survey http://www.bls.gov/cps/demographics.htmLinks to an external site. WOMEN IN POLITICAL POWER Women in Congress: CAWP (Women in Congress) linkLinks to an external site. Rubric Application #5 DATA and METHODS Application #5 DATA and METHODS Criteria Ratings Pts This criterion is linked to a Learning OutcomeHeaders The Data and Methods sections each have the appropriate headers ("Data" and "Methods") 4 pts Full Marks 0 pts No Marks 4 pts This criterion is linked to a Learning OutcomeData Description The data section full describes the data YOU will use for your study. 8 pts Full Marks 0 pts No Marks 8 pts This criterion is linked to a Learning OutcomeMethods Secription The methods section accurately describes YOUR method of analysis. 8 pts Full Marks 0 pts No Marks 8 pts Total Points: 20 PreviousNext
View Related Questions